
The attraction of a new AI tool is the possibility of more room for the work—and life—you care about. The honest way to evaluate that possibility is to compare one familiar task before and after. Claude Sheets and Whiteboards make it easier to organize that experiment, but the outcome still has to be measured.
What Anthropic announced
On November 10, 2026, Anthropic introduced Claude Sheets and Whiteboards in beta and made Claude Data, formerly Dashboards, generally available on paid plans. Sheets supports editable formulas and Excel/CSV export; Whiteboards supports shared visual planning. Data works with connected data sources and adds visual stories, including narrated videos. Certified queries and live sharing remain beta features.
Interactive connectors are also expanding to full app views where supported, including Adobe and Atlassian. Availability depends on rollout and organizational settings. Claude Meetings is described as coming soon in the overview; the Whiteboards help page documents Google Meet beta support on Team and Enterprise. Check your account before planning around it; Zoom and Microsoft Teams are not supported in that documented beta.
Before you start
Open Claude and confirm that your paid account has the Sheets and Whiteboards templates in Artifacts. Team plans enable them by default; an Enterprise owner must enable them. If a template is missing, check your plan and organization settings before following this exercise. No live meeting or connected business account is required for the sample below.
Start a chat, paste the labeled sample data and ask for a Sheet. In a separate request, ask for a Whiteboard using the reviewed findings. Copy the relevant context explicitly: the Whiteboards help page says connected-app context is not currently available to the board. These are suggested prompts, not a transcript of a hands-on test in Claude.
Your four-step workflow
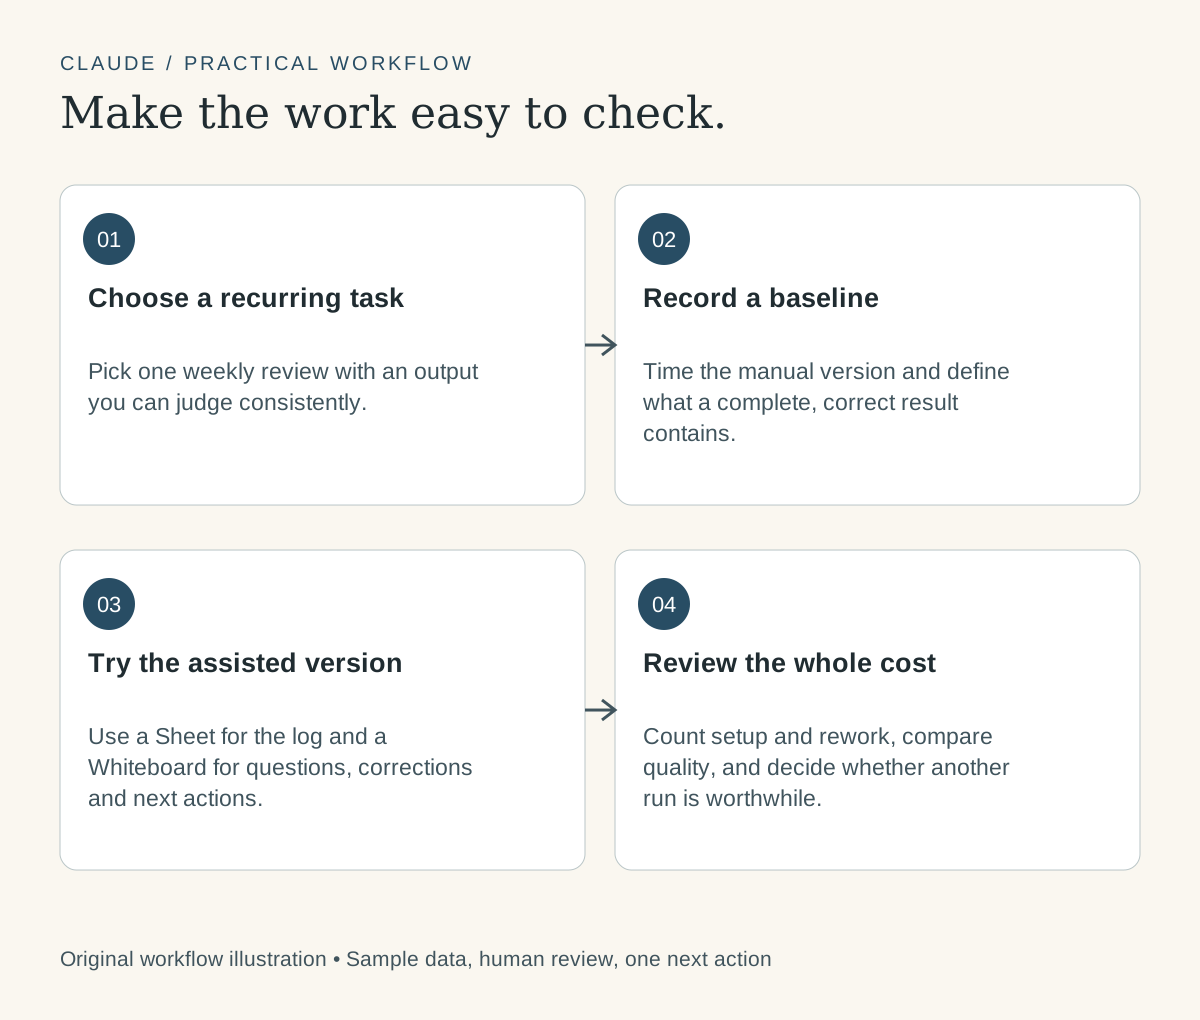
- Choose a recurring task. Pick one weekly review with an output you can judge consistently.
- Record a baseline. Time the manual version and define what a complete, correct result contains.
- Try the assisted version. Use a Sheet for the log and a Whiteboard for questions, corrections and next actions.
- Review the whole cost. Count setup and rework, compare quality, and decide whether another run is worthwhile.
Worked example: Is an assisted weekly review worth repeating after setup and correction time?
Fictional practice example. These inputs and expected outputs demonstrate the method. They are not client results, portfolio metrics or evidence that this task was run in Claude.
| Task | Manual minutes | Assisted minutes |
|---|---|---|
| Gather records | 25 | 20 |
| Build summary | 40 | 15 |
| Review and correct | 15 | 25 |
Paste this prompt into Claude
Create a Claude Sheet using only the following SYNTHETIC PRACTICE DATA. Do not connect accounts or invent missing values. Keep raw inputs separate from calculations. Include visible formulas and an Assumptions tab. The decision is: Is an assisted weekly review worth repeating after setup and correction time?

Task,Manual minutes,Assisted minutes
Gather records,25,20
Build summary,40,15
Review and correct,15,25

Use these formulas, with the header in row 1:
B5 = SUM(B2:B4)  → manual total
C5 = SUM(C2:C4)  → assisted total
D5 = B5-C5  → difference
E5 = 30/D5  → runs to recover a separate 30-minute setup, if D5 is positive

Explain the calculation and flag missing inputs. Keep zero denominators blank and identify why the result is unavailable. Do not claim these are real business results.
Check the expected result
The illustrative manual total is 80 minutes and the assisted total is 60. That is 20 minutes less per comparable run. A separate 30-minute setup would be recovered after two completed runs at that same difference.
The first assisted run including setup takes 90 minutes, ten more than the manual baseline. Two assisted runs plus setup take 150 minutes versus 160 manually. These are arithmetic examples, not measured results from Ashley’s businesses. Actual tasks may take longer, fail review or need different inputs.
Turn the reviewed result into a board
Create a Whiteboard for this reviewed sample. Make four sections: Evidence, Assumptions, Open questions, and Next action. Evidence: The illustrative manual total is 80 minutes and the assisted total is 60. That is 20 minutes less per comparable run. A separate 30-minute setup would be recovered after two completed runs at that same difference. Interpretation to review: The first assisted run including setup takes 90 minutes, ten more than the manual baseline. Two assisted runs plus setup take 150 minutes versus 160 manually. These are arithmetic examples, not measured results from Ashley’s businesses. Actual tasks may take longer, fail review or need different inputs. Add one owner and review-date placeholder; do not invent names or commitments. Keep the sample labeled fictional. Do not send messages or change connected apps.
Make the handoff useful
Keep this experiment small enough to finish. Record what happened, what remained unclear and the next test. Time saved on an acceptable result is useful; extra output that nobody uses is harder to value. Use a personal time budget and a real task instead of a broad promise that AI will multiply your income.
Before sharing, check one ordinary row, one missing value and one zero-denominator case. Confirm that totals use the intended rows. Open the exported Excel file and inspect formulas and formatting; a CSV export does not preserve a workbook’s tabs and presentation. Share only the reviewed version with the intended people.
If you later use Claude Data, inspect the data source, metric definition and refresh time. Ask for the uncertainty to appear in any data story. If Meetings is available to your team, follow your organization’s participant-notice and recording practices; otherwise use notes you are permitted to share. The worksheet exercise works without a meeting assistant.
Try it on one real task
Replace the sample with data you are authorized to use, keep the same review question and record what needed correction. A useful first result is a checked artifact and a decision someone can act on.
Official sources
Feature information checked November 11, 2026. Examples, prompts and interpretation are original editorial guidance.